I ran my paper analysis pipeline once again in order to get statistics for 2020. It certainly was an unusual year. While ML and NLP conferences again had more publications than ever before, most of them needed to quickly adapt to a new remote format. Each conference took a slightly different approach as everyone was trying to figure out how to make this work. I heard especially positive comments about EMNLP 2020, regarding their smooth organisation and engaging technical solutions. Overall, I think the remote format has its pluses and minuses - while it certainly complicates networking and socialising, it also makes these conferences much more accessible to a wider range of audience. Hopefully the online participation options will be made available even after we are able to have in-person meetings again.
This post includes the analysis of publications from the following conferences and journals: ACL, EMNLP, NAACL, EACL, AACL, COLING, TACL, CL, CoNLL, NeurIPS, ICML, ICLR, AAAI. All the information is crawled and processed automatically from the corresponding proceedings and directly from the pdf files. Some noise likely still remains, so the graphs are more indicative of general trends as opposed to specific paper counts. Big thanks to Jonas Pfeiffer (@PfeiffJo) for adding the country annotations to all the new organisations, so that we can also run the country-level analysis below.
These statistics are not meant to imply that the quantity of publications is an important measure of a researcher. Having one groundbreaking paper is always more meaningful than churning out many forgettable pieces. But it can be a good way of getting an overview of active research groups and hopefully it can inspire new researchers to publish their own work.
Venues
Let's start by looking at the overall number of papers published at different venues. Following the trends from the previous few years, most venues continued to break records in this regard. ML and AI conferences such as NeurIPS, AAAI and ICML had particularly large increases in paper numbers. ACL and EMNLP had more modest increments, but still more than ever before. CoNLL took a slight decrease in numbers, possibly due to narrowing their focus back towards linguistics as opposed to engineering. AACL was introduced as a brand new conference for the Asia-Pacific Chapter of ACL.
Organizations
Looking at which organizations published most papers in 2020, it is clear to see that Google manages to dominate this space. Microsoft holds a respectable second position and CMU is the the top publishing university. MIT, Berkeley, DeepMind and Oxford are mostly publishing only at ML conferences. In contrast, Microsoft, Tencent, Uni. of CAS, Alibaba and Amazon have significant proportions of their publications at NLP conferences.
Looking at the statistics for the whole 2012-2020 period, the top three positions are nailbitingly close: Microsoft still leads with 1580, then Google with 1570 and CMU with 1537.
Most of the top publishing organizations also have upward trajectories through the years. Google has a bizarrely straight line going up at 45 degrees for the past few years; I can almost imagine some strategist drawing this with a ruler in their company plan.
Authors
Next, let's look at the researchers who published the most papers in 2020. Graham Neubig from CMU ranks first in this aspect, with 31 publications. Others with impressive numbers of papers include Yue Zhang (Westlake University), Sergey Levine (UC Berkeley), Ting Liu (Harbin Institute of Technology), Zhiyuan Liu (Tsinghua University) and Ming Zhou (Microsoft Research Asia).
Comparing the counts across the whole period of 2012-2020, Ming Zhou from MSR Asia has taken the overall lead. He was ranked third in 2019 and published an impressive 28 papers in 2020, while Yoshua Bengio and Chris Dyer (who were the top two until last year) have considerably scaled down their paper numbers this year.
The breakdown over the years gives an overview of when each researcher has published most. Yue Zhang and Ting Liu have both improved their overall ranking, having had a particularly successful last year in terms of publishing. While Sergey Levine still holds the overall record of most papers per year, Graham Neubig managed to publish the most in 2020.
First Authors
The most published researchers are generally supervisors for many students/post-docs performing the practical experiments. In contrast, first authors are usually those who do the legwork, implementing the actual code and writing much of the paper.
Normally, I would make a chart showing the most publishing first authors from the last year. However, this time all the top ranks were cases where two or more people were publishing under the same name. I don't currently have any technology that can automatically identify and disambiguate these authors (future research project perhaps?) so I'm skipping this graph and jumping straight to the overall statistics between 2012-2020. Zeyuan Allen-Zhu (MSR AI), Jiwei Li (Shannon.AI) and Ivan Vulić (Cambridge/PolyAI) have the most impressive publication records as first authors, with Zeyuan publishing in the ML area, Jiwei and Ivan publishing mostly in NLP.
Countries
Separating the statistics by country highlights just how much the United States publishes. China is giving a strong effort as well, with the UK being third.
While China is definitely publishing more and more every year, it seems the US still manages to increase the lead. Overall, there is a general trend for more papers and most countries continue to increase their scientific output.
USA
As the United States publishes so much, the USA-only breakdown looks very similar to the combined graph, with Google, Microsoft and CMU in the lead.
China
In China, Tsinghua, Peking, the Chinese Academy of Sciences and Tencent are the top publishing organizations.
UK
In the UK, DeepMind is the top publisher and the large majority of their papers are in NeurIPS, ICLR or ICML. Oxford and Cambridge are also not far behind, with Cambridge having a much larger NLP proportion than the other two.
Germany
Rober Bosch GmbH is the top publishing organisation in Germany this year, with a very impressive NeurIPS result. Darmstadt comes in second as the top university and with a much larger NLP output. Tübingen ranks third with almost all papers in ML conferences.
Canada
In Canada, University of Toronto is the top ranking organisation in terms of publishing. Vector Institute ranks second and McGill third.
Topic Similarity
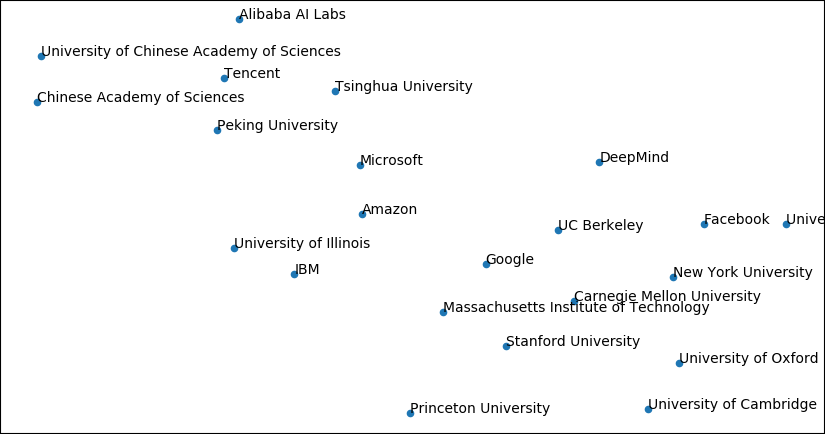
Just for fun, I also ran the papers through LDA and then visualised them using t-SNE.
Looking at the top publishing organisations, there is a clear geographic separation happening on the left and right side of the graph. In the middle we have global companies, such as Google, Amazon and Microsoft.
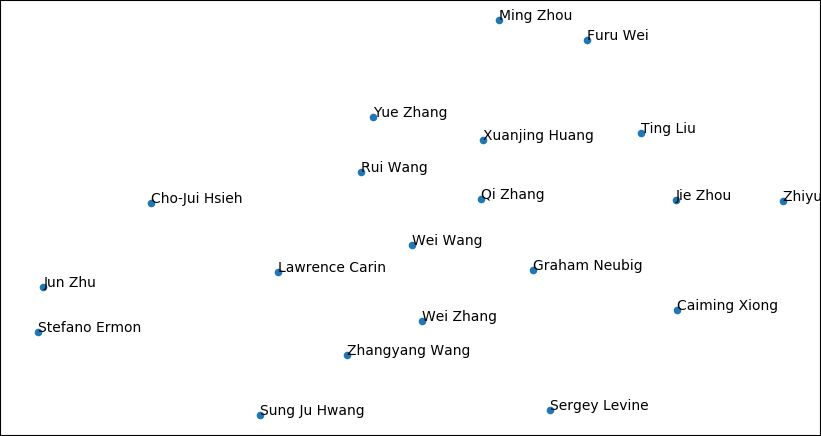
Another LDA graph for the top publishing authors of 2020. If you spot any interesting clusters here, let me know in the comments as well.
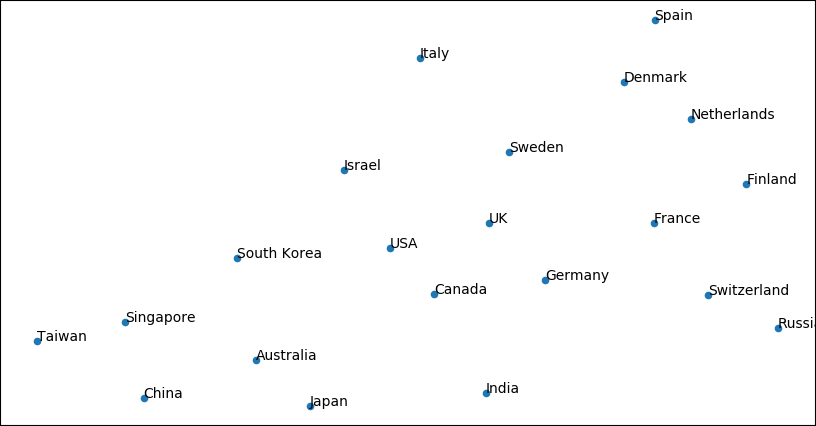
Finally, plotting the countries. Geographic proximity seems to carry over directly to paper similarity. One possible explanation is that neighbouring countries are more likely to publish together, which would make their paper collections also more similar.
Keywords
As a new addition, I thought it might be informative to also plot the usage of different keywords in papers. Here the y-axis represents the proportion of papers that contain that specific keyword, as opposed to an absolute count.
It is interesting to see how the word "neural" has increased in popularity over the years, now plateauing at over 80% of all the papers. "Recurrent" and "convolutional" have taken downward directions, while "transformer" has a steep rising trajectory. It is nice to see a gradual rise of "github", which implies that more papers are making their source code available.
Just looking at the keyword "neural", we see that almost all papers in ICLR and NeurIPS are mentioning it. The proportion is consistently high also in other conferences, although not quite to the same level. Interestingly, EMNLP, CoNLL and CL have actually reduced the proportion of neural papers in recent years.
At least in CoNLL, some of those "neural" papers have been replaced by "bayesian" papers instead. For EMNLP, the trend is more stable. For most conferences, the "bayesian" proportion seems to have a slight downward trend overall, with CoNLL and ICLR being the exceptions.
Distribution of "github" shows indeed that the practice of releasing source code is becoming more common in all the conferences. The NLP conferences are still doing much better in this respect, compared to all the ML conferences, with TACL and EMNLP having close to 80% of the papers mentioning github. In contrast, ICLR is around 60% and AAAI is the lowest with 40%.
Fun Facts
And a couple more random facts to finish:
- Most authors on a single paper: Task-Oriented Dialogue as Dataflow Synthesis in TACL with 45 authors. This doesn't quite take the all-time record but gets an honorable second position.
- The longest paper title: Code-Switching Patterns Can Be an Effective Route to Improve Performance of Downstream NLP Applications: A Case Study of Humour, Sarcasm and Hate Speech Detection at ACL 2020.
- The shortest paper title: Ode to an ODE at NeurIPS 2020.
That's it for this year. I hope you found something interesting. The full processed dataset of published papers is available in this repository: https://github.com/marekrei/ml_nlp_paper_data
Have a great year of publishing excellent work! May reviewer #2 be merciful to you. And if you invent AGI in the next 12 months, make it benevolent.
Great analysis, thanks for putting in this work.
It’s a bit like music charts, there are some songs that everyone knows, some bands that churn out a lot, some songs that everyone knows – but then there are also the rare masterpieces of “one hit wonder bands” in the long tail.
BTW, “DFKI”, “DFKI GmbH” and “German Center for Artificial Intelligence” are the same unit, so once integrated, the output numbers align more with expectation.
For any students who read this, volume can also mean pressure, real or perceived, and volume isn’t always quantity (although on average I would say the most productive organizations listed here all also have very high standards), and you can get an excellent education also at many smaller places that naturally won’t feature in this stats – at least not until Graham Neubig moves there.
Some ideas for future work:
– a map of what kind of research topics are pursued where and how prominently
– cluster by city instead of organization (e.g. Saarbrücken and Tübingen have both highly ranked universities and Max Planck Institutes in the same city that both feature in these stats; similarly London has UCL/Imperial/Kings/Google/Google Brain/Facebook/Twitter/…).
– normalize by size and research funding (peer reviewed paper per head; peer reviewed paper per funding dollar)
– industry/academia comparisons (I’m very interested in this because I’m active in both)
Thanks for letting me know about DFKI, I’ll fix it for next time.
And thanks for the suggestions. I’ve been thinking of doing some sort of topic analysis on the papers. But I haven’t found any good off-the-shelf tools that can assign reliable interpretable topic labels to these papers. If you have suggestions, let me know.