It is about time we once again take a look at the publication statistics of the past year. 2019 was another record breaking year in machine learning and NLP research. Nearly all conferences had more attendees and more publications than ever before. For example, NeurIPS had 6,743 submissions and 1,428 accepted papers, which eclipses all the previous iterations. Because the conference sold out so fast last year, the organizers had to implement a randomised lottery for the tickets this time.
In this post you will find a number of graphs to illustrate the publication patterns from 2019.
I have included the following conferences and journals: ACL, EMNLP, NAACL, EACL, COLING, TACL, CL, CoNLL, NeurIPS, ICML, ICLR, AAAI. The paper information is crawled and processed automatically from the corresponding proceedings. While names and titles are quite easily accessible, getting the author affiliations is the noisiest part of the process, as this needs to be extracted directly from the pdf files. I've kept improving the pipeline every year so it should be more accurate than any of the previous iterations. If you do spot some mistakes, let me know.
The analysis this year includes some brand new statistics and graphs. This is thanks to Jonas Pfeiffer (@PfeiffJo) and Andrew Caines (@cainesap) who annotated the extracted organization names with origin countries. Andrew started the process with a subset of 2018 conferences for our joint article on The Geographic Diversity of NLP Conferences. Jonas then scaled this up to cover all of the organizations in all the conferences in this analysis. This allows us to create some new country-specific visualisations, which you'll see below.
While this post highlights authors and organizations who have published the most in the past year, I want to emphasize that publication quantity should not be used as the main metric for good research. It's always better to have one really groundbreaking and influential piece of work over 10 forgettable and incremental papers. These statistics are just meant to give an informative overview of the most active publication centres in this field and hopefully inspire some new researchers to publish their own ideas.
Venues
Essentially all conferences had record-breaking numbers of publications in 2019. The journals have a fairly stable publication rate, COLING and EACL didn't happen this year, and every other conference just grew substantially. NeurIPS is by far the biggest conference and it now has a lead of nearly 300 papers over AAAI.
Organizations
Let's see which organizations published the most in 2019. Google has taken a comfortable lead, publishing a substantial number of papers in every venue. They had more than twice as many papers at ICML as the next closest organization (MIT). Worth noting that in previous years I included DeepMind papers also under Google, whereas this time DeepMind is separated as its own entity. Microsoft and CMU are also publishing an impressive amount of research.
Next up, we can see the overall stats between 2012-2019. While Google is dominating the previous year, CMU and Microsoft are still ahead in the marathon. Notably, the counts for CMU and Microsoft came out identical(!), with 1,215 papers from both organizations. After them, the main heavy hitters are Google, Stanford, MIT, IBM, Berkeley and Tsinghua.
If we look at the separation in time, we see that Google is sort of a late bloomer. Compared to Microsoft and CMU they were publishing much less between 2012-2016, but have overtaken everyone else by quite a bit after that. All of the top players seem to have an upward trend and they all published more in 2019 than ever before.
Authors
Looking at individual authors, Sergey Levine (Berkeley) published an impressive 33 papers in 2019 - 12 in NeurIPS, 6 in ICML and 15 in ICLR. The other top authors are Graham Neubig (CMU), Yoshua Bengio (Montreal), Zhiyuan Liu (Tsinghua), Tao Qin (MSR) and Tie-Yan Liu (MSR).
Looking at the whole period of 2012-2019, we see that Yoshua Bengio (Montreal) has overtaken Chris Dyer (DeepMind) as the most prolific author. Ming Zhou (MSR), Yue Zhang (Westlake), Noah A. Smith (Washington) and Ting Liu (Harbin) all have more than 90 papers from that period. I have had to remove Yang Liu from the list, as there seem to be two or more people publishing under this name and I was not able to automatically separate them.
And looking at the separation in years shows that Sergey Levine, Graham Neubig and Yoshua Bengio have all overtaken the previous publication record set by Chris Dyer in 2016. They each also published considerably more than they did in the previous years.
First Authors
The authors with the highest publication counts are often the leaders of large groups, coordinating the work. But now let's see the first authors, who are usually the people doing the actual implementation and writing. Gabriele Farina is a 4th year PhD at CMU and he has authored 6 papers in 2019, half of them at NeurIPS. Ilias Diakonikolas (UW Madison), Hanrui Zhang (Duke), Rui Zhang (NUS), Chuhan Wu (Tsinghua), Pengcheng Yang (Peking), Sanjeev Arora (Princeton), Zeyuan Allen-Zhu (MSR) and Mikhail Yurochkin (IBM) were all first authors to 5 publications.
Looking at first-author papers through time, Zeyuan Allen-Zhu (MSR), Jiwei Li (Shannon AI), Ivan Vulić (Cambridge), Ryan Cotterell (Cambridge), Young-Bum Kim (Amazon) and Sanjeev Arora (Princeton) have published the most overall.
Countries
For the first time we are now actually able to analyse which countries published the most in 2019. Admittedly, this graph mainly highlights just how much the US dominates the research in this area. China, UK, Germany and Canada are also putting in a strong effort. China has a proportionally very large presence at AAAI, whereas the US is publishing more in NeurIPS and ICML.
The picture looks very similar when looking at the whole 2012-2019 period.
Through the years, the US has always published much more than everyone else and now the pace has accelerated even more. China is also trying to match this and has increased the lead over all the others by quite a bit. The UK is in a respectable third position.
USA
We can also take a look at the 2019 publishing statistics of individual organizations within each country/continent. Given how much the US publishes, the graph here looks sort of similar to the overall statistics, with Google in the lead.
China
In China, Tsinghua and Peking universities distinctly stand out in terms of publication numbers. The other top ranks are also mostly held by universities, with Baidu and Alibaba being the main industry publishers.
UK
In the UK, DeepMind takes the lead. They are followed by Cambridge, Oxford, Edinburgh, UCL, Imperial and the Alan Turing Institute. Worth noting that the Turing institute is largely virtual, so academic there often have affiliations with other universities as well. Out of the top 7, Cambridge and Edinburgh publish quite a bit in NLP, while the others are focusing mainly on ML.
Germany
In Germany, Darmstadt is the top publisher, with 2/3 of the papers in published in the area of NLP. Bosch is putting up some competition, ranking second with mostly ML papers. Saarland, LMU Munich, Tübingen, TU Munich and the Max Planck Institute for Intelligent Systems are also represented at the top.
Canada
Among the Canadian organizations, University of Toronto stands out with an impressive publication count. Université de Montréal and the Vector Institute are also at the top, along with Alberta, McGill, Waterloo, MILA and University of British Columbia. University of Waterloo seems to be the only one with a larger focus on NLP, with the others publishing mostly in the general ML conferences.
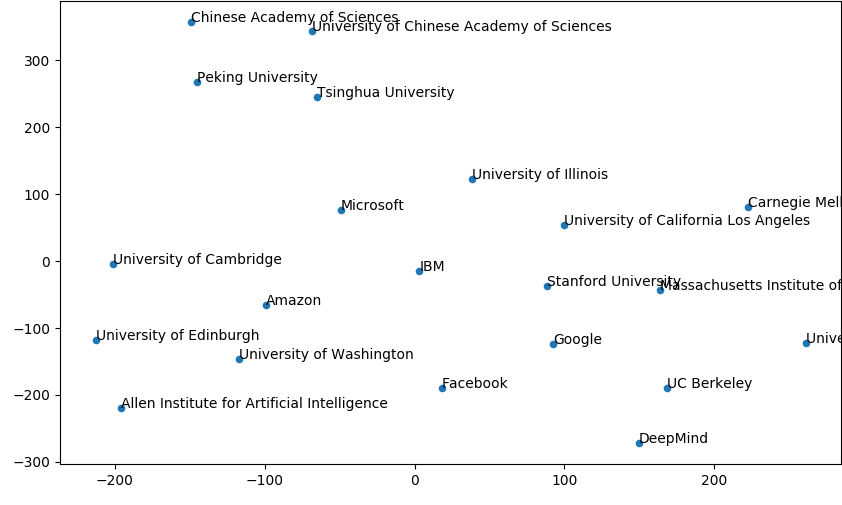
Topic Similarity
To try and capture a bit about the topics in the papers as well, I ran them through LDA and then visualised the results with t-SNE. Looking at the organizations, it is interesting to see how geographical clusters emerge. Chinese universities are at the top, US mostly on the right, Europe on the left, and industry right in the middle.
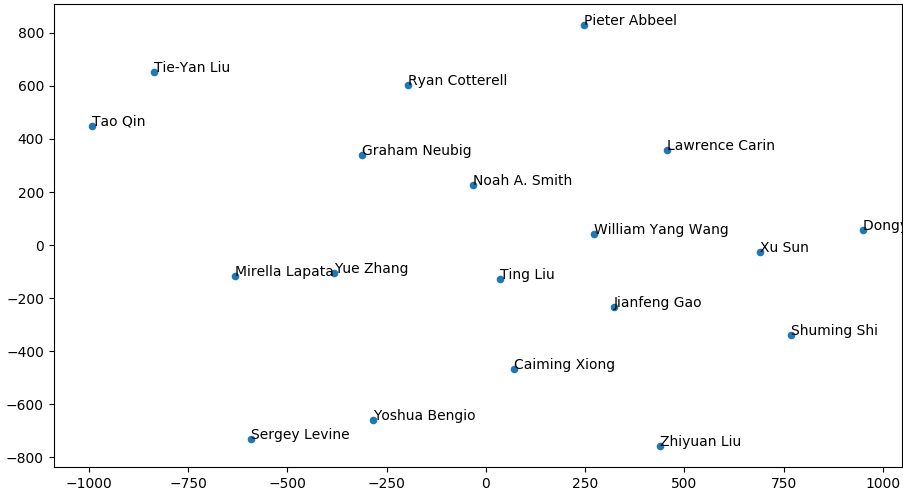
We can do the same for authors. The closeness in the graph reflects a combination of topic similarity and the frequency of collaboration.
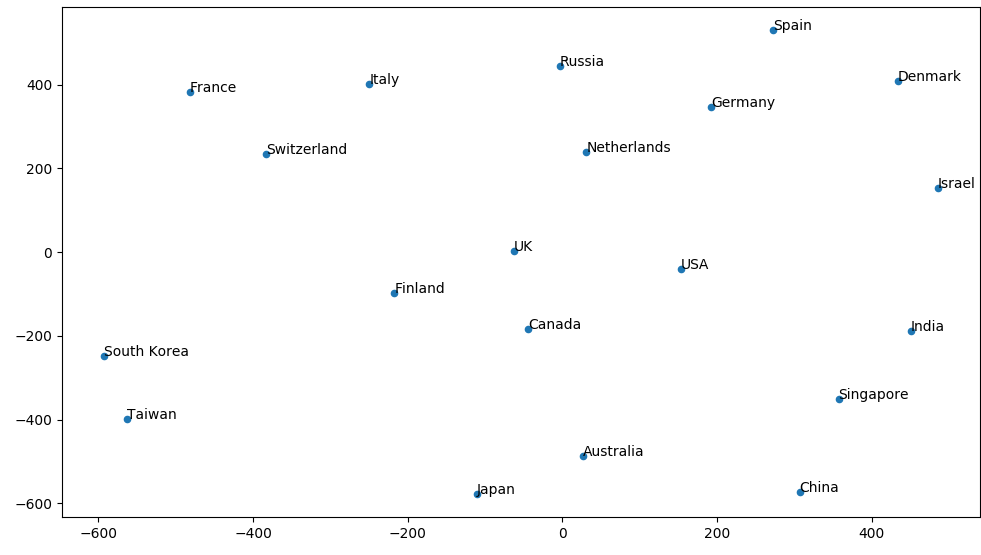
Finally, we can do the same for countries. Given that all countries are working on a range of different topics, this graph is likely more representative of their collaboration frequency.
Additional Statistics
Finally, let's finish off with a couple of fun stats.
- Percentage of papers mentioning GitHub (indicating that the code is made available): ACL 70%, EMNLP 69%, NAACL 68%, ICLR 56%, NeurIPS 46%, ICML 45%, AAAI 31%. It seems the NLP papers are releasing their code much more freely.
- Percentage of papers mentioning MNIST: NeurIPS 20%, ICML 25%, ICLR 32%. Seems like it's still a cornerstone of ML research.
- Most authors on a single paper: 24. CoSQL: A Conversational Text-to-SQL Challenge Towards Cross-Domain Natural Language Interfaces to Databases
- The longest paper title: What if We Simply Swap the Two Text Fragments? A Straightforward yet Effective Way to Test the Robustness of Methods to Confounding Signals in Nature Language Inference Tasks
- The shortest paper title: Graph U-Nets
That's it for this time. Looking forward to all the interesting work that is going to be published in 2020!
The data used in this post can be found here.
Could you share the dataset that you used to create these charts? I’d like to explore co-authorship in greater detail to see what clusters emerge (if any)
The data can now be found here: https://github.com/marekrei/ml_nlp_paper_data
Wow! At last I got a website from where I be capable of truly get
helpful data concerning my study and knowledge.
Marek, thank you so much for your efforts! It’s great stuff!
But do you think it is reasonable to shrink the presence of some peripheral countries by assigning company affiliations to the Head Quarters? I’ve noticed, i.e. that if Samsung is mentioned it gets attributed to “South Korea” regardless of branch location.
Could you, please, show the script for creating an arbitrary json file, say just for NeuroIPS-2019, to see how the result could be made closer to Web of Science query on the same conference?
May be in private mail?